Piratepad visualizations
Live infographics of Piratepad notes for a heritage conference.
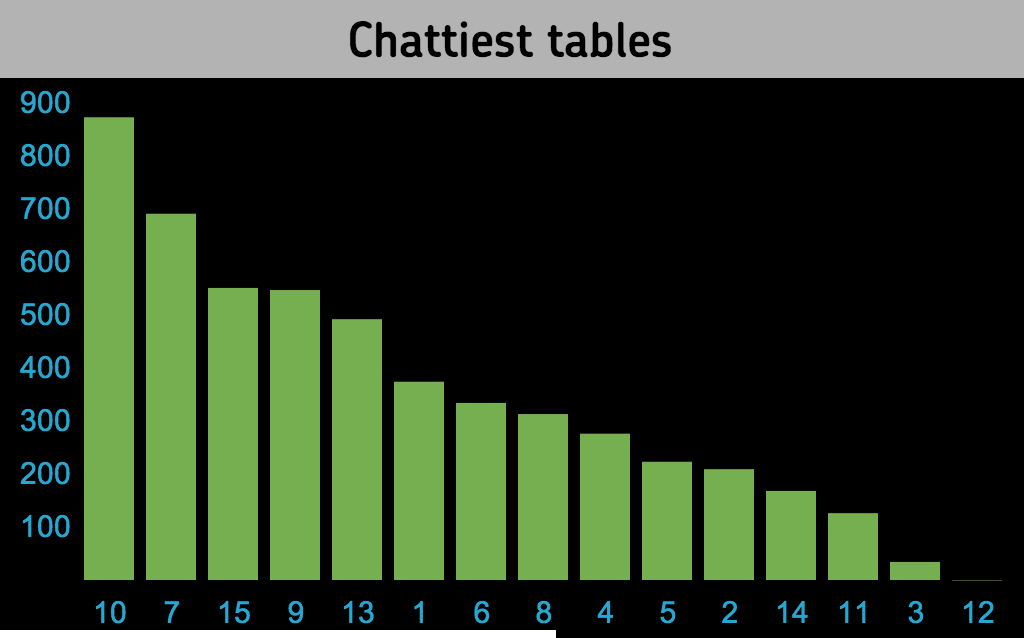
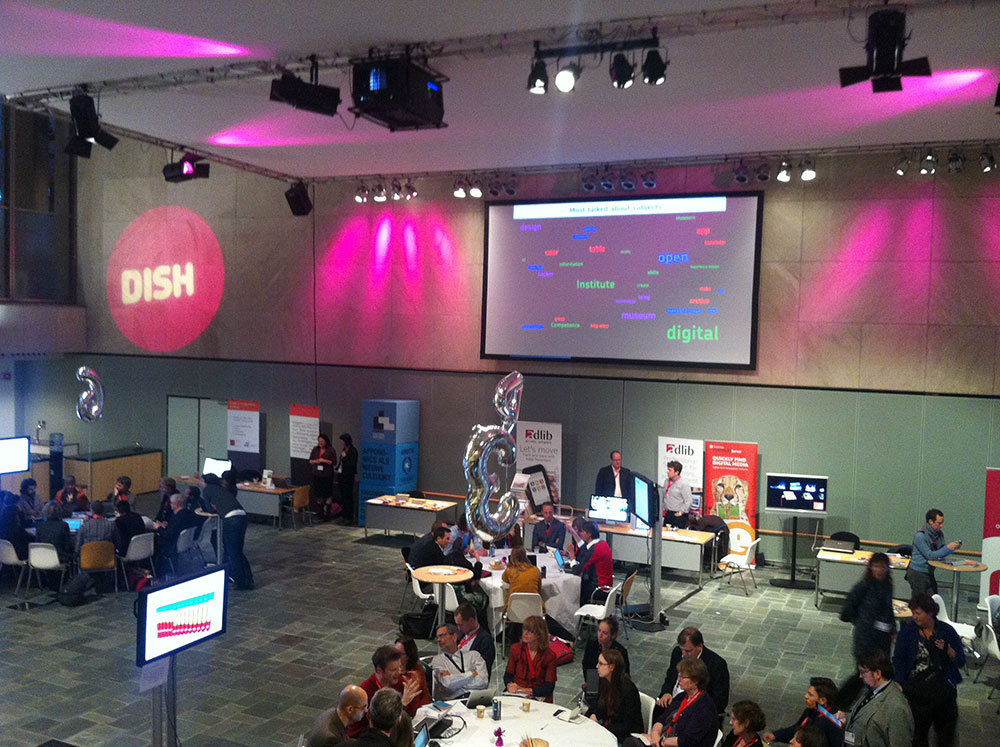
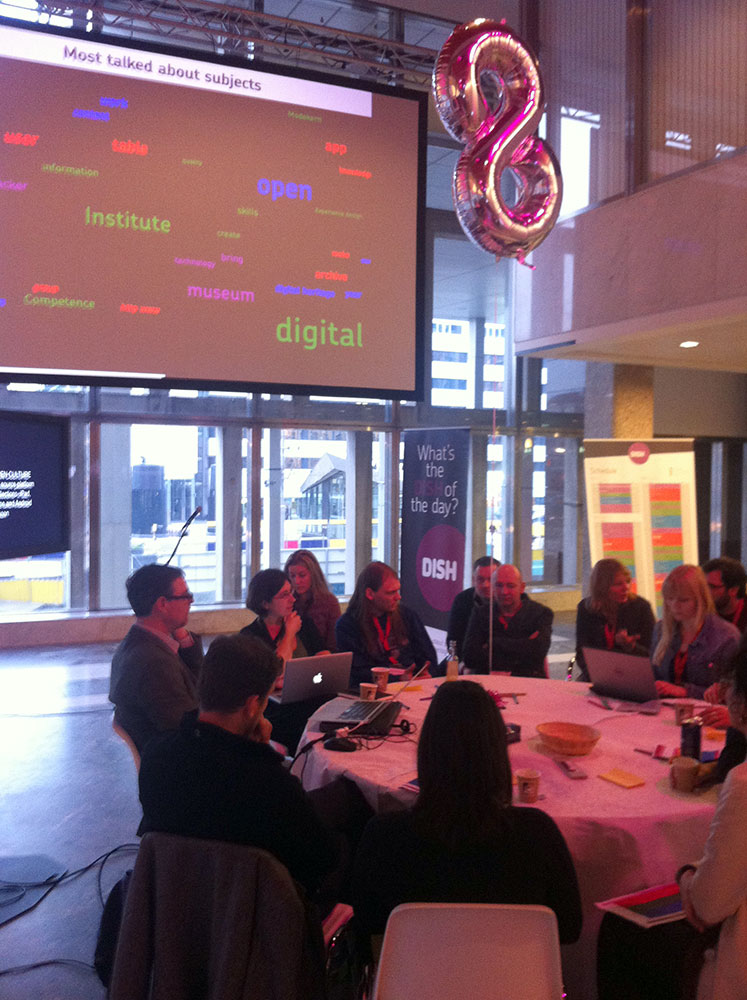
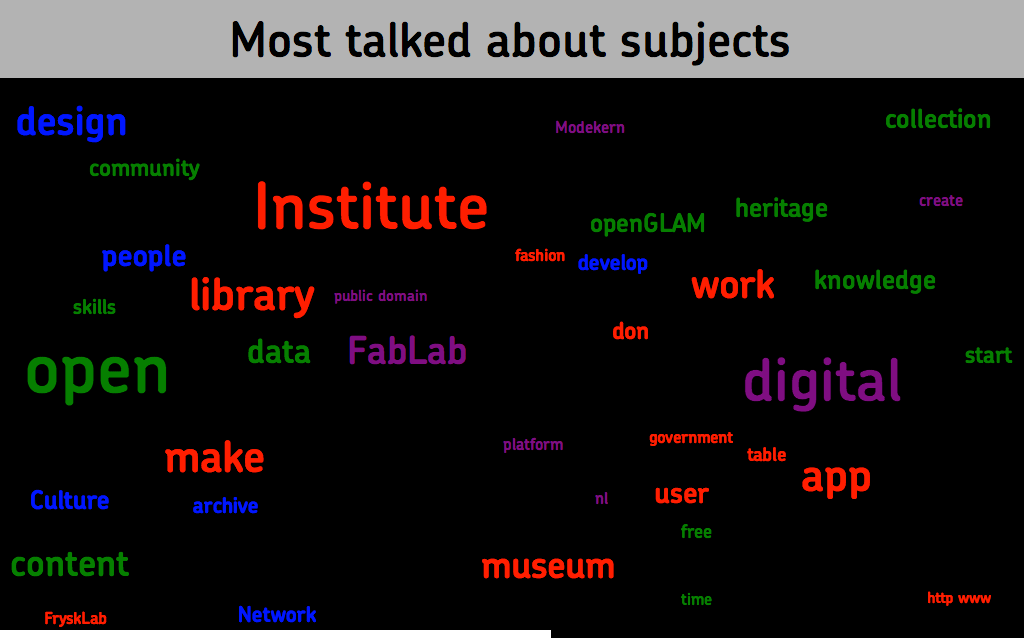
For DISH 2013, a bi-annual international conference on digital heritage i made a live visualization of the so called Chef’s tables, 15 short workshops done at the same time.
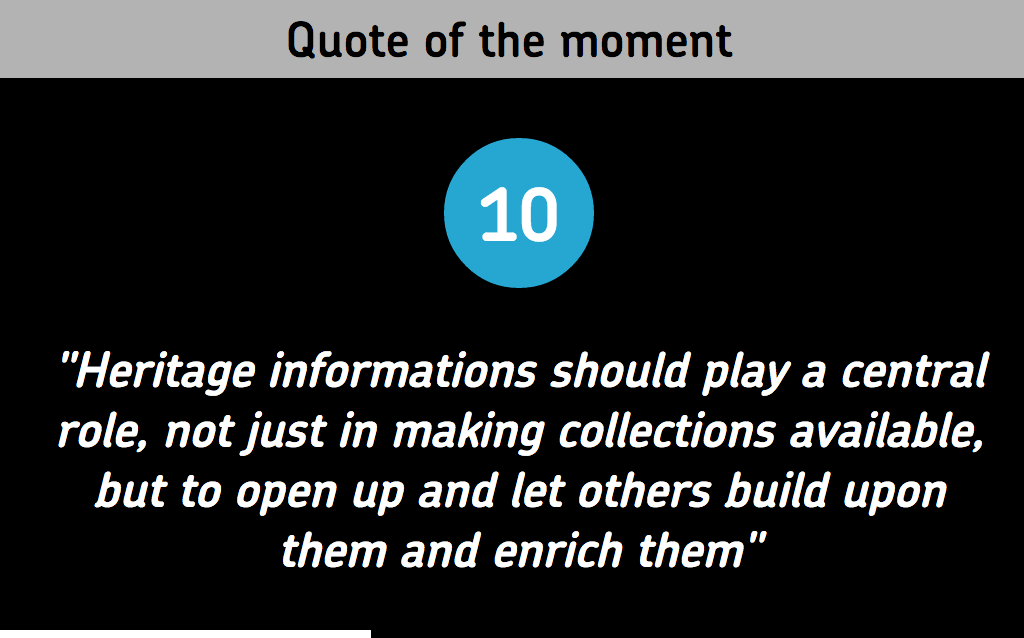
Every table had somebody taking notes using Piratepad. I visualized all of these notes at the same time on the big screens at the conference using word clouds, bar charts (for the ‘chattiest table’) and a quote and tweet of the moment.
The visualization was completely based on open web technologies like HTML5, CSS, Javascript, Chart.js.